Horse Racing Odds Explained: Markets, Margins and How Prices Are Made

The first time I properly understood horse racing odds, I was standing in a betting shop in Doncaster watching two men argue about whether 5/2 or 3.5 was the better price. They were talking about the same horse. Neither realised it. That moment crystallised something for me: the numbers mean nothing if you do not understand the language they are written in and the machinery behind them.
Odds are not just a payout calculation. They encode probabilities, reflect market dynamics, and carry the fingerprints of the people and algorithms that created them. A price of 4/1 on a racecard represents a chain of decisions — a bookmaker’s tissue pricing, a trader’s reaction to money coming in, an exchange user’s assessment of true probability, and the collective intelligence (or panic) of thousands of punters. Reading odds properly means reading all of that, not just the fraction on the screen.
This guide breaks down how horse racing prices work in the UK, from the basic formats through to the structural differences between bookmaker and exchange markets. By the end, you will understand where margins hide, why some price types consistently outperform others, and how to spot market movements that signal genuine information.
- Fractional, Decimal and American: Three Languages for the Same Thing
- How Bookmakers Set Prices
- Understanding Overround: The Built-In House Edge
- The Exchange Model Explained
- Commission and Net Returns
- SP vs Early Prices vs Best Odds Guaranteed
- Market Movement and Steamers
- Worked Example: Comparing Margins Side by Side
- Turning Odds Literacy Into a Practical Edge
Fractional, Decimal and American: Three Languages for the Same Thing
Walk into any British betting shop and the prices are fractional: 5/2, 7/4, 11/8. Open an exchange app and they switch to decimal: 3.50, 2.75, 2.38. Visit an American sportsbook and you get +250, -133, +138. Three systems, one concept. Your profit depends on understanding all three, because the best price on a given horse might appear in any format depending on where you are looking.
Fractional odds tell you the profit relative to your stake. At 5/2, a one pound stake returns two pounds fifty in profit plus your stake back — three pounds fifty total. At 7/4, you profit one pound seventy-five. The first number is always profit; the second is what you risk. Decimal odds tell you the total return including your stake. At 3.50 decimal, a one pound stake returns three pounds fifty total. To convert fractional to decimal, divide the first number by the second and add one: 5/2 = 2.5 + 1 = 3.50. American odds use a baseline of 100: positive numbers show profit on a 100-unit stake (+250 means 250 profit on 100 staked), and negative numbers show how much you must stake to profit 100 (-133 means stake 133 to win 100).
For practical purposes in UK racing, you need fractional fluency for bookmaker prices and decimal fluency for exchanges. I default to decimal for all my calculations because the maths is cleaner — multiplying stake by decimal odds instantly gives the total return, with no fractional arithmetic required. When I see 11/8 on a bookmaker screen, I convert it to 2.375 in my head before doing anything else. That conversion takes about a second once you have practiced it for a week, and it eliminates the errors that creep in when you try to calculate returns on an 11/8 shot with a complex stake.
One trap: «odds-on» pricing. Fractional odds like 4/5, 1/2, or 2/7 confuse newcomers because the first number is smaller than the second, meaning you risk more than you stand to profit. In decimal, odds-on prices sit below 2.0. A horse at 4/5 (1.80 decimal) returns one pound eighty for every pound staked. These are the favourites that most casual punters gravitate toward, and they are precisely the horses where margin compression eats into your returns most aggressively.
How Bookmakers Set Prices
I used to think bookmakers just picked numbers that felt about right. The reality involves tissue prices, risk models, and a team of traders whose job is to balance the book while protecting the firm’s margin. Understanding this process changes how you read a price on a racecard.
It begins with the tissue — a set of estimated probabilities for every runner, compiled by the bookmaker’s in-house handicapper. The tissue is the firm’s best guess at each horse’s true chance before any money arrives. A horse the tissue gives a 25% chance becomes roughly 3/1, but the bookmaker does not offer 3/1. They shorten it to perhaps 5/2 or 11/4, building margin into every price. Every runner gets the same treatment, and the sum of implied probabilities across the field exceeds 100%. That excess is the overround, and it is how the bookmaker guarantees a theoretical profit regardless of the result.
Once the market opens, traders adjust prices based on the money arriving. Large bets on a particular horse trigger shortening — the price drops. When that horse shortens, other runners in the field drift, because the total implied probability must remain above 100% for the margin to hold. This is a dynamic, continuous process. Between the market opening in the morning and the off at 3:15, prices can shift dramatically. A horse that opens at 8/1 might go off at 4/1 if serious money backs it, while a horse that opens at 5/2 might drift to 7/2 if the anticipated support never arrives.
The crucial insight for punters: early prices reflect the bookmaker’s opinion, shaped by the tissue and refined by initial money. Late prices reflect the market’s opinion, shaped by the collective weight of all bets placed. Neither is «correct» in any absolute sense, but the gap between them tells you something. If a horse opens at 8/1 and closes at 4/1, the market thinks the bookmaker’s initial assessment underestimated its chance. If you backed it at 8/1, you got value. If you waited until 4/1, you got the market’s reappraisal — and paid for the privilege.
Understanding Overround: The Built-In House Edge
Overround is the single most important concept in betting that most punters never learn. I have met people who have been betting for twenty years and cannot tell you the overround on the race they are about to back a horse in. It is like playing poker without knowing the rake — you are paying a cost you cannot see, and it is eating your bankroll one race at a time.
The calculation is straightforward. Convert every price in the race to an implied probability, sum them, and subtract 100. If a five-runner race has implied probabilities of 35%, 25%, 20%, 12%, and 15%, the total is 107%. The overround is 7%. On a typical UK handicap with twelve to sixteen runners, the overround sits between 12% and 20% with traditional bookmakers. On smaller fields — two or three runners — the overround can drop below 5% because each price is scrutinised more closely by the market.
What does overround mean in practical terms? On a race with a 15% overround, you are paying roughly 15% more for your bet than you would in a perfectly fair market. Over a hundred bets at level stakes, that 15% bleeds your bankroll dry even if your selection ability is average. Backing winners at a 33% strike rate sounds healthy until you realise the average price you are getting already has 15% margin baked in, so your actual return is lower than the raw numbers suggest.
Overround is not distributed evenly across the field. Bookmakers compress their margins hardest on the favourites and spread them more widely on the outsiders. A favourite that should be 2/1 might be offered at 15/8. An outsider that should be 25/1 might be offered at 20/1. The percentage discount is larger on the outsider — a full 20% shorter than fair value — while the favourite is only about 6% shorter. This is the favourite-longshot bias in action. Bookmakers know that casual punters are drawn to big prices, and they tax those prices more heavily. UK betting data shows that blindly backing favourites in flat handicaps returns roughly minus seven pence in the pound over the long term, while blindly backing horses at 20/1 or longer returns closer to minus thirty pence.
Comparing overround across bookmakers before placing a bet is one of the simplest edges available to any punter. A race might carry a 17% overround with one firm and 11% with another. That 6% difference goes directly to your bottom line. I check three or four bookmaker prices as standard before every bet. It takes twenty seconds and it adds up over hundreds of races.
The Exchange Model Explained
When I moved from bookmaker betting to exchanges in 2016, the shift felt like switching from buying at retail to trading on a stock exchange. The product is the same — a bet on a horse — but the mechanism, the pricing, and the possibilities are fundamentally different.
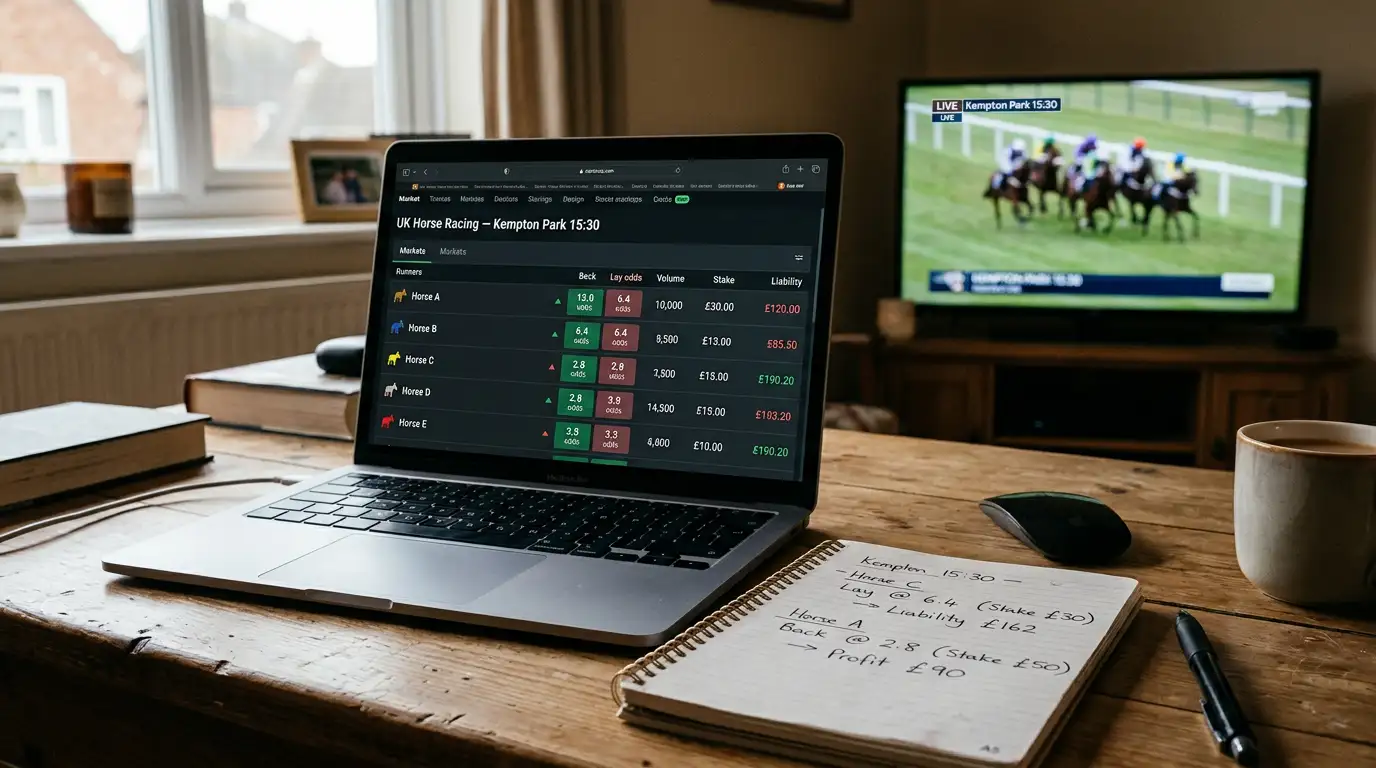
On a betting exchange, there is no bookmaker. Punters bet against each other. If you want to back a horse at 4.0 (3/1), you need another user willing to lay that horse at 4.0. The exchange matches the two sides and charges a commission on the winner’s net profit, typically between 2% and 5% depending on the platform and your volume. The exchange itself takes no market risk — it earns the commission regardless of which horse wins.
This structure eliminates the overround in the traditional sense. The «market» on an exchange is simply the collective opinion of its users, expressed through back and lay prices. In liquid markets — Saturday feature races, Cheltenham Festival, Royal Ascot — the sum of back-side implied probabilities often falls between 100.5% and 102%. Compare that to the 112-118% you find with bookmakers on the same race. The difference is stark, and it flows directly into better prices for backers.
Exchanges also let you lay horses — bet against them winning. This is an entirely separate strategic dimension that bookmakers do not offer at all. If you believe a heavily backed favourite is overrated by the market, you can lay it at 2.5 (6/4) and profit when it loses. Your liability is the difference between the odds and your stake: a ten-pound lay at 2.5 creates a fifteen-pound liability (ten times 1.5). If the horse loses, you keep the backer’s ten pounds minus commission. The mechanics of lay betting and Dutching strategies open up approaches that pure bookmaker punters cannot access.
The trade-off is liquidity. Exchange markets are deep on big races but thin on Monday evening meetings at Wolverhampton. Trying to back a horse at 6.0 on an exchange when only forty pounds is available at that price means you either take a small bet or accept a worse price. Bookmakers will take your fifty-pound bet at 5/1 without blinking, even if the exchange price is technically better, because they manage risk across thousands of customers. For smaller stakes on smaller races, bookmakers sometimes win on execution even when their headline odds are worse.
Commission and Net Returns
Exchange commission is the invisible cost that people forget when comparing exchange prices to bookmaker prices. A horse at 4.0 on the exchange looks better than 3/1 (4.0 decimal) at a bookmaker — same price, right? Not once you factor in commission.
At 5% commission, your net return on a winning ten-pound back bet at 4.0 is not thirty pounds profit. It is thirty pounds minus five percent of thirty, which is twenty-eight pounds fifty. The effective odds drop from 4.0 to 3.85. That erosion is small on any single bet, but across a thousand bets in a year it adds up to a meaningful drag on returns. When I compare exchange and bookmaker prices, I always convert the exchange price to its commission-adjusted equivalent before deciding where to place the bet.
The formula is simple: Effective Decimal Odds = ((Exchange Price – 1) x (1 – Commission Rate)) + 1. At 4.0 with 5% commission: ((4.0 – 1) x 0.95) + 1 = 3.85. At 4.0 with 2% commission: ((4.0 – 1) x 0.98) + 1 = 3.94. The difference between 2% and 5% commission rates might look trivial on a single calculation, but over a full year of active betting it represents a significant shift in net returns.
Commission also affects lay bets differently. When you lay, you are liable for the difference between the odds and one, multiplied by the backer’s stake. If the horse loses, you keep the backer’s stake minus commission. So commission reduces your income on winning lays just as it reduces your profit on winning backs. On a lay at 4.0 for ten pounds, if the horse loses, you receive ten pounds minus 5% commission — nine pounds fifty net. If the horse wins, you pay out thirty pounds. The asymmetry between small wins and large losses on lay bets means commission compounds the structural risk of laying at longer prices.
Volume-based commission tiers reward frequent traders. High-volume exchange users can negotiate or earn commission rates below 2%, which makes the exchange price advantage over bookmakers even more pronounced. If your annual betting turnover justifies pursuing a lower rate, the cumulative benefit across hundreds of bets is substantial.
SP vs Early Prices vs Best Odds Guaranteed
Three years ago I backed a horse at 14/1 in the morning. By the off it was 6/1. Thanks to Best Odds Guaranteed, I collected at 14/1. The following week I took SP on a horse I fancied late, and it went off at 3/1 having been available at 9/2 all morning. Two bets, two different price strategies, two very different outcomes. Price type selection is not an afterthought — it is a decision that directly affects your long-term return.
Starting Price (SP) is the official odds at the moment the race begins, determined by on-course bookmakers and the official SP reporter. SP reflects the final state of the market after all money has been placed. The advantage of SP is that you do not need to commit early — you can wait until close to the off, assess the market, and let the system determine your price. The disadvantage is that you have no control. If the horse shortens from 10/1 to 5/1 during the day because sharp money backs it, you get 5/1. You spotted the horse, you did the work, and you got the price that reflects everyone else spotting it too.
Early prices are the odds available from the morning onwards, sometimes the night before for big races. Taking an early price locks in your odds at that moment, regardless of subsequent market movement. The risk is that the horse drifts — if your 5/1 shot weakens to 8/1 by the off, you are stuck at the shorter price while latecomers get better value. But for horses you expect to shorten — those with strong form, popular trainers, or a profile that attracts public money — taking the early price captures value before the market catches up.
Best Odds Guaranteed (BOG) is the mechanism that resolves this tension for bookmaker punters. Under BOG, if you take an early price and the SP is higher, the bookmaker pays you at the SP. You get the best of both worlds: protection against shortening plus the upside if the horse drifts. BOG is available with most major UK bookmakers on domestic horse racing and represents a genuine structural advantage for the punter. I take early prices on horses I expect to shorten and rely on BOG to cover me if I am wrong about the direction. The one caveat: BOG does not apply on exchanges, and some bookmakers exclude certain promotions or races from the guarantee, so checking the terms before assuming you are covered is essential.
Market Movement and Steamers
A horse that opens at 12/1 and goes off at 5/1 has «steamed» — shortened sharply in the market due to sustained backing. The opposite movement, a horse drifting from 3/1 to 6/1, is a «drifter.» These movements are among the most revealing signals available to anyone watching the betting market, because they reflect the actions of people putting real money behind their opinions.
Not all steamers are equal. A horse that shortens from 12/1 to 5/1 in the final ten minutes before the race is being backed by people who had information — or at least confidence — they waited until the last moment to deploy. Late steamers in UK racing have historically outperformed the market’s expectation. That is to say, horses whose odds shorten by 50% or more in the final fifteen minutes win more often than their final price implies they should. The reverse is also true: late drifters underperform, losing more often than their lengthening odds suggest.
Morning steamers are a different story. A horse that shortens from overnight prices through the morning might be reacting to newspaper tips, social media tipsters, or early each-way money from casual punters. The information content of morning moves is lower than that of late moves because the money driving them is less sophisticated on average. I treat morning shortening as noise unless it is accompanied by exchange price movement in the same direction, which suggests that sharp money and public money are aligned.
Monitoring market movement does not mean chasing steamers. By the time a horse has shortened from 12/1 to 5/1, the value has gone. The people who profited are the ones who backed it at 12/1 — or earlier. Market movement is most useful as a confirmation tool. If my form analysis identifies a horse and the market subsequently moves in its favour, that confirms my reading. If the horse drifts despite strong form, I ask why: is there information in the market that I have missed? Has the ground changed? Did the horse not travel well to the course? Sometimes the drift reveals nothing except weak public support, and the price becomes even better. Other times the drift reflects something material — a horse seen sweating up in the paddock, a trainer’s lukewarm comments on social media — and caution is warranted.
Worked Example: Comparing Margins Side by Side
Let me put the theory into numbers with a six-runner race. I will show you how the same race looks through three lenses: a traditional bookmaker, an odds comparison across firms, and an exchange.
Six horses, one race. The bookmaker’s prices: 2/1, 3/1, 5/1, 8/1, 10/1, 16/1. Convert to implied probabilities: 33.3%, 25.0%, 16.7%, 11.1%, 9.1%, 5.9%. Sum: 101.1%. Wait — that looks too tight for a bookmaker. Let me adjust to a more realistic set: 7/4, 5/2, 9/2, 7/1, 10/1, 14/1. Implied probabilities: 36.4%, 28.6%, 18.2%, 12.5%, 9.1%, 6.7%. Sum: 111.5%. There is the overround — 11.5%. The bookmaker has built in an 11.5% margin across the field.
Now check a second bookmaker on the same race: 2/1, 5/2, 4/1, 8/1, 12/1, 16/1. Implied probabilities: 33.3%, 28.6%, 20.0%, 11.1%, 7.7%, 5.9%. Sum: 106.6%. The overround is 6.6% — nearly five percentage points less than the first firm. If you were backing the favourite, the first bookmaker offers 7/4 (effective 36.4% implied probability) while the second offers 2/1 (33.3%). That difference — evens out to roughly one free bet in every six at those odds. The second firm is offering you a significantly better deal.
On the exchange, the back prices for the same race might read: 2.2, 3.8, 5.5, 9.6, 14.0, 19.0. Implied probabilities: 45.5%, 26.3%, 18.2%, 10.4%, 7.1%, 5.3%. Sum: 101.8%. After adjusting for 5% commission, the effective decimal odds on the favourite become ((2.2 – 1) x 0.95) + 1 = 2.14. The exchange offers the tightest market by a wide margin, with almost no overround, but the commission clips the headline advantage. For the favourite backer, the commission-adjusted exchange price of 2.14 is still better than the first bookmaker’s 2.75 (7/4) but barely edges the second bookmaker’s 3.0 (2/1). For the 9/2 shot, the exchange at 5.5 minus commission (effective 5.275) beats both bookmakers comfortably.
This exercise takes two minutes. Running it before every bet — checking at least the bookmaker odds, the exchange price, and doing the commission adjustment — is one of the simplest habits that separates profitable punters from the rest. You are not finding better horses. You are getting better prices on the same horses. Over a season, that margin compounds into the difference between a losing year and a breaking-even one, or a breaking-even year and a profitable one.
Turning Odds Literacy Into a Practical Edge
Understanding odds formats, overround, exchange mechanics, and market movement is not abstract theory. It is the operational layer that sits beneath every bet you place. A punter who can read the form but ignores the price structure is like a trader who analyses companies but never checks what price the stock is actually trading at. The selection is half the equation. The price is the other half.
Every concept in this article — overround comparison, commission adjustment, BOG exploitation, market movement reading — is a lever. Pull them consistently, race after race, and the cumulative effect reshapes your returns. None of them requires special software or insider connections. They require attention, a calculator, and the discipline to shop for prices instead of settling for the first number you see. The market is a machine built to extract money from people who do not understand it. Understanding it is the first step to reversing that flow.
Are exchange prices always better than bookmaker prices?
Not always. On popular races with deep liquidity, exchange prices are usually tighter. On smaller races with thin markets, bookmakers may offer comparable or better prices because you can get matched at full stake. Commission also reduces the exchange advantage. Compare both before every bet.
What is a good overround to look for?
On exchanges, anything below 103% is typical for liquid races. With bookmakers, below 110% indicates a competitive market. Above 115% means the margins are heavy and your long-term returns will suffer unless you are consistently picking winners at an above-average rate.
Should I always take early prices?
Take early prices when you expect a horse to shorten based on your form analysis. If you are uncertain about market direction, Best Odds Guaranteed protects you on the downside while preserving the upside. Only take SP if you have no opinion before the race or are betting very close to the off.
How do I track market movement effectively?
Most racing websites and apps show live price changes. Watch for significant shortening in the final 15 minutes before a race — these late moves carry the most information content. Compare the morning price to the off price to gauge the direction and strength of market confidence.
Creado por la redacción de «Betting Strategy for Horse Racing».