Favourite-Longshot Bias in Horse Racing
 Available in US
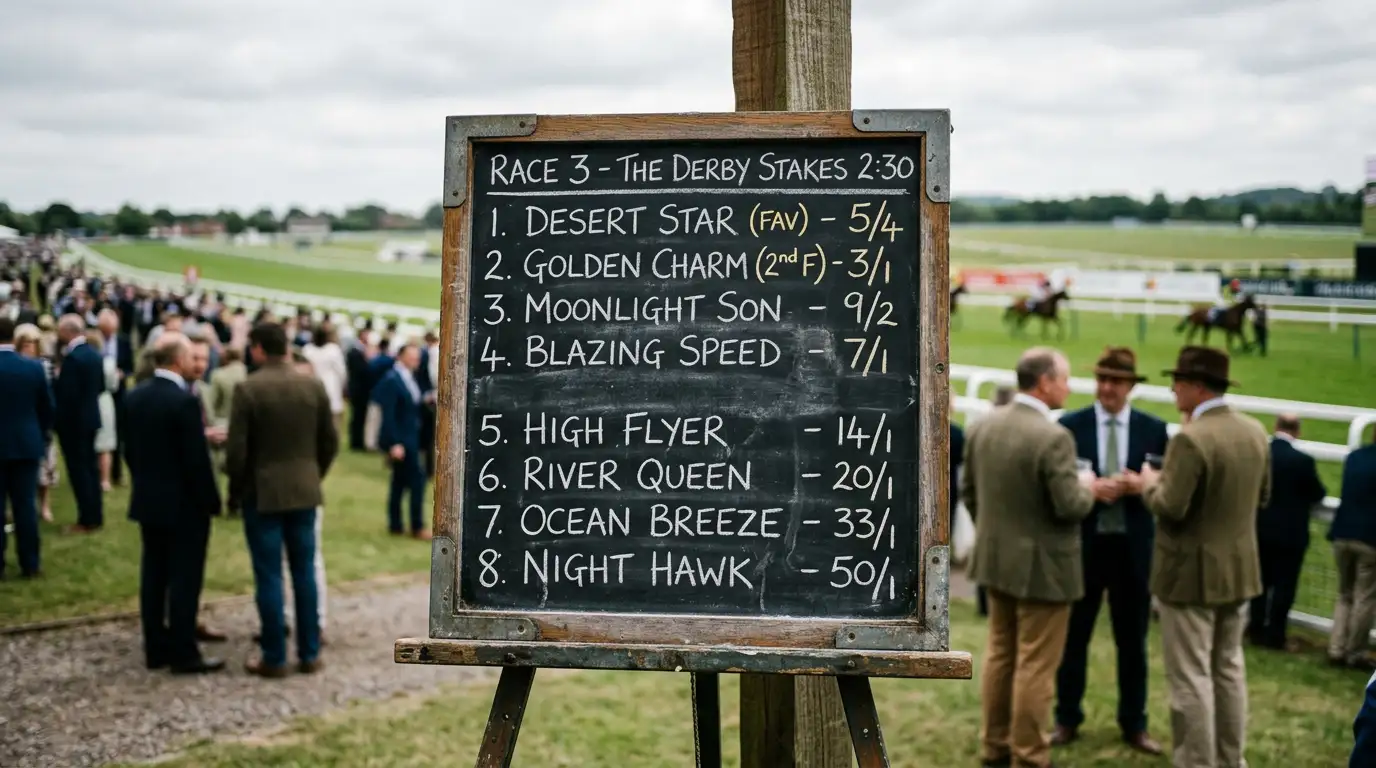
If you have ever placed a 50/1 bet because “the price is too good to ignore”, I have unhappy news. That price was almost certainly not too good. It was, in the long run, much too short for the chance you were buying. The favourite-longshot bias is one of the most thoroughly documented anomalies in any betting market, and it has been quietly skimming money from optimistic punters for as long as bookmakers have framed prices.
I describe it as quiet because it doesn’t announce itself. No single 50/1 winner contradicts it; in fact, a few well-timed longshot wins per year are what keeps punters coming back. The bias only shows up when you aggregate thousands of bets and compare what the prices implied against what actually happened. When you do, the pattern is brutal: short prices roughly track reality, long prices overstate the chance of winning, and the gap widens the further out you go.
Academic Statistics on Market Bias
Years ago I sat with a friend who managed a small betting fund and watched him pull up his historical record. He had broken down every flat handicap bet his team had placed over a five-year window, sorted by starting price. The pattern was clean enough to plot on the back of a beer mat. Bets between roughly 2/1 and 4/1 were losing slowly. Bets at 6/1 to 10/1 were losing faster. Bets above 16/1 were a bonfire. The frustration in his voice was about how obvious it became once the noise was washed out.
The published research tells the same story. Long-run analyses of UK and Irish exchange data over a decade show that blindly backing favourites at Betfair Starting Price returns somewhere around minus 7% — bad, but not catastrophic. Move out to horses ranked ninth or tenth in the market and the same blind-backing strategy loses 40% or more. American academic work on a sample of more than six million races found that blind backing of favourites lost at a rate of roughly 5.5%, while bets at decimal odds between 4.0 and 16.0 lost at around 18%, with steeper losses still at longer prices.
Those numbers are not opinions. They come from a clean comparison: implied probability versus realised win rate, averaged across enough bets to drown out variance. The implied probability at long prices systematically exceeds the actual win rate. The implied probability at short prices roughly matches reality, give or take the bookmaker’s margin. The whole curve tilts the same way, race after race, year after year.
Why the bias refuses to disappear
Markets usually arbitrage anomalies into nothing. The favourite-longshot bias has had decades to vanish. It hasn’t. Three explanations do most of the work in explaining why.
The first is utility. A small stake at 50/1 buys a lottery-ticket experience: a long afternoon of hope and the dream of a transformational payout. Punters demand less in expected value when they’re paying for that emotional product, so they accept worse prices on it. Bookmakers, sensibly, take the money. The product is psychologically distinct from a 6/4 bet on a favourite, where the punter is closer to investing than dreaming.
The second is information. Markets price favourites tightly because professional money concentrates there. The serious bettors are running form models, watching steam moves, and trading positions. Their activity squeezes the favourite end of the market until it reflects reality reasonably well. The longshot end of the market doesn’t attract the same attention. There’s less smart money to discipline the prices, so the prices sit out where the public taste puts them.
The third is bookmaker structure. Books price every runner in a race, and the margin they take must come from somewhere. The cleanest place to embed extra margin is on the long-priced runners, because no individual bet on them is large and no individual punter cares deeply about the precise price. A horse that “should” be 80/1 might be offered at 50/1; nobody is going to mount a campaign against the bookmaker over twenty-six points of value on a 50/1 chance. Over thousands of such bets, the margin accumulates handsomely.
These three forces reinforce each other. None of them is going away. The bias has survived the arrival of exchanges, the rise of algorithmic trading, and the maturation of UK racing markets. It will survive the next innovation too.
UK markets versus US markets
The bias is global, but it’s not uniform. American pari-mutuel pools, where punters bet against each other rather than against a bookmaker, show the strongest version of the curve — particularly at the very long end, where the takeout is large and the dreamer money flows freely. Hong Kong’s pools, famously efficient, show a milder version. UK markets sit somewhere in the middle.
Within the UK, the bias is more pronounced on bookmaker prices than on exchange prices. Betfair starting prices, set by market activity rather than by a margin-loaded book, tend to be closer to fair odds at the long end than their high-street equivalents. They’re still tilted — exchanges don’t make the bias disappear — but the tilt is gentler. If you’re going to back longshots anyway, the exchange is a less expensive place to do it.
National Hunt versus flat is a more subtle comparison. The bias exists in both codes, but jumps racing involves longer fields, more attritional outcomes, and a higher non-completion rate, all of which can amplify the gap at the longest prices. A 33/1 shot in a twenty-runner steeplechase faces a meaningfully different reality than a 33/1 shot in an eight-runner conditions race on the flat, even before the bookmaker margin is added. The structural difference matters when you’re trying to think clearly about which longshots to bother with.
The other piece of the puzzle is how prices get built in the first place — the overround, the role of market percentages, the difference between exchange and sportsbook structure. I cover that machinery in my guide to horse racing odds and market structure.
What this means in practice
The practical takeaway is not “never bet longshots”. That would be too strong, and it would ignore the genuine angles that occasionally produce well-priced outsiders. The takeaway is that longshots need a substantially bigger edge before they’re worth backing, because you’re starting from a worse base.
If a 4/1 chance is priced fairly when you assess its true win rate at 20%, a 33/1 chance priced fairly would need a true win rate of about 3%. The bookmaker, in practice, isn’t offering you a fair 33/1 — they’re offering you a worse-than-fair version. To overcome that, your edge on the longshot needs to be wider than your edge on the favourite. Most longshot punters have neither the data nor the discipline to identify those situations consistently. They’re backing horses because the prices feel exciting.
The cleaner application of the bias is defensive. When you’re building any kind of value model, weight the implied probabilities at long prices downward before doing your comparison. A horse the market has at 25/1 is implying roughly a 3.8% win rate; the bias tells you the real rate is materially lower than that. So your model needs to show a true rate above 4% just to break even on that bet, and several points above 4% to be worth backing. The threshold is harder to clear than the raw odds suggest.
The other application is to your enjoyment. If you bet longshots as entertainment — a flutter on a name you like, a Grand National annual ritual, a small stake on an outsider in a big handicap because the romance is irresistible — that is entirely fine, and I won’t lecture you. But understand what you’re buying: an experience, not an investment. The expected return is negative and the price tag for the experience is the margin embedded in those long odds. Profitable punting is a marathon, not a sprint — and the marathon doesn’t run through the 50/1 territory unless you’ve done serious work to earn the right to be there.
Where this leaves the disciplined punter
The bias is one of the few empirical regularities in racing that punters can act on without complicated tools. Stay in the price range where the market is closest to efficient — broadly 2/1 to 8/1 — and you start from a smaller hole. Move outward only when you have a specific, defensible reason to think the price is wrong, and discount the implied probability of any horse priced above about 12/1 before comparing your view to the market’s.
None of this guarantees profit. Plenty of disciplined punters lose money. But ignoring the bias guarantees a wider average loss, and a wider average loss compounds savagely over a betting career. Recognising it is one of the cheapest improvements anyone can make to their long-run results — no software, no subscriptions, no extra hours of form study. Just the willingness to take 33/1 a little less seriously than it sounds.
How much worse is ROI on long-priced horses compared to favourites?
In long-run UK and Irish exchange data, blind backing of favourites at BSP returns around minus 7%, while blind backing of horses ranked ninth or tenth in the market returns minus 40% or more. The wider American academic dataset of over six million races shows favourites losing at roughly 5.5% and bets at decimal odds 4.0 to 16.0 losing at around 18%. The pattern is consistent: as the odds lengthen, the realised loss rate widens significantly.
Why does the favourite-longshot bias still exist if it’s well known?
Three forces keep it alive. Punters accept worse prices on longshots because they’re partly paying for the dream of a big payout. Professional money concentrates on favourites, so the favourite end of the market is disciplined while the long end isn’t. And bookmakers find it easier to load margin onto long-priced runners, because no individual bet is large enough to provoke a fight over the price. Together those forces are stable and self-reinforcing.
Does the bias apply to UK National Hunt races as well as flat?
Yes — the bias appears in both codes, but the texture differs. National Hunt fields are typically larger, races are more attritional, and non-completion is more common, all of which can amplify the gap between implied and actual win rates at the longest prices. Flat racing shows the same shape on a milder curve. In both codes the bias is sharper on sportsbook prices than on exchange prices, where market-driven pricing flattens the tilt slightly.
Prepared by the Betting Strategy for Horse Racing editorial staff.