Draw Bias in UK Horse Racing: When Stall Numbers Decide Outcomes
 Available in US
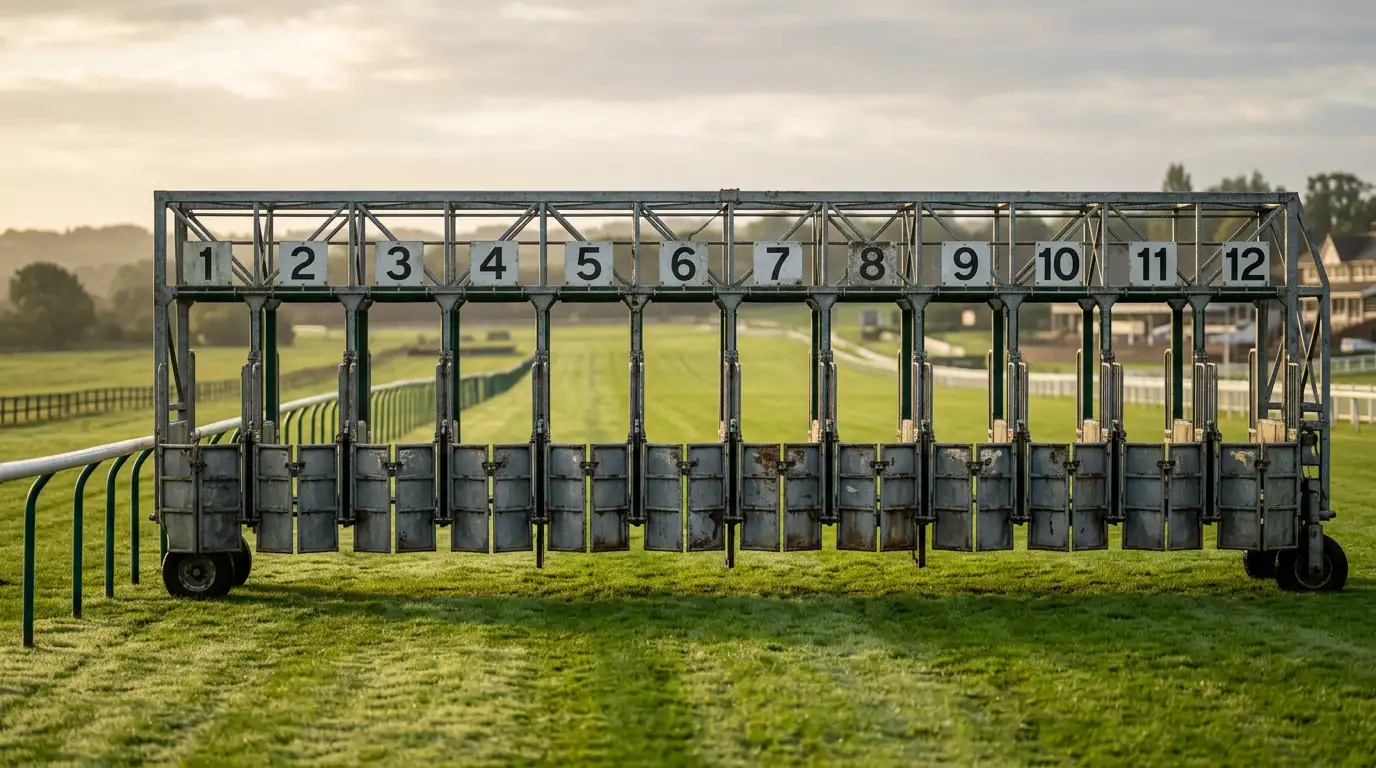
An old trainer once told me, “Worry less about the horse and more about the stall.” He wasn’t being literal, but the point lodged. Some UK courses produce results that have less to do with the relative quality of the runners than with which stall the horses happened to be drawn in. Get the wrong stall at the wrong course on the wrong day, and the most talented horse in the race can be finishing without ever having had a chance to win.
Draw bias is a measurable, statistically significant advantage or disadvantage attached to particular starting positions on specific courses and distances. It is not luck. It is not bad weather. It is the cumulative effect of track geometry, going, pace, and field size producing systematic patterns that, in some cases, have persisted for decades. The punter who ignores it is betting blind to a factor that the local handicappers and trainers absolutely do not ignore.
What actually causes draw bias
The geometry of the track does most of the work. A course with a sharp bend close to the start gives the inside-drawn horses a shorter route to the rail, which translates directly into less ground covered over the full race. A long straight start before the first bend allows horses to find their preferred position regardless of stall, which dilutes the bias. The interaction of distance and bend placement is the first thing to understand for any course you want to bet at seriously.
Going compounds the geometric effect. On rain-softened ground, certain courses develop a faster strip along one side of the track — usually the inside rail, where the camber sheds water — while the rest of the surface becomes harder going. Horses drawn on the wrong side spend the whole race on slower ground while their rivals enjoy the better strip. Watering patterns at modern UK courses do something similar: water applied to one side leaves the unwatered strip running faster, creating an artificial bias that the racecourse manages deliberately but that punters need to read.
Pace contributes a third layer. A horse drawn ideally for early position but slow out of the stalls loses the geometric advantage that should have been theirs. A horse drawn poorly but with rapid early speed can recover from a bad draw to find a better position. The interaction means that draw bias isn’t just about the stall — it’s about which stall suits which kind of horse. A front-runner needs a draw that lets them lead; a hold-up horse can tolerate a wider draw because they don’t need an early rail position.
Field size matters too, and is often misunderstood. Bias is sharpest in big fields, where the volume of traffic forces every horse to take a position quickly and there’s no time to adjust. In small fields with seven or eight runners, there’s room for any horse to find any position, and the geometric advantage of a particular stall becomes noise. Bias is real in large-field handicaps; in small-field conditions races it usually washes out.
UK courses where the bias is genuinely strong
Chester is the famous example. The course is short, tight, and almost entirely turning, with no real straight worth speaking of. Horses drawn low get to the rail first and stay there; horses drawn high spend the race trying to get back across to a position that was lost at the stalls. The bias at Chester is so strong that it overrides ordinary form analysis. A modestly rated horse drawn low can comfortably beat a much better horse drawn high, particularly over the shorter trips.
Beverley’s five-furlong sprint course runs uphill with a noticeable advantage to high draws on certain ground conditions. Goodwood’s downhill bends and sharp gradients create distance-specific draw patterns where the same course produces different biases over different trips. Brighton’s hilly, tight track has well-known draw effects in sprints. Catterick’s downhill five-furlong sprint has produced one of the most consistent draw patterns in UK racing for decades. Each of these courses has its own profile, and the patterns aren’t always intuitive — a course that favours low draws over six furlongs might be neutral over a mile.
The contrast is with courses like Newmarket, where the broad straight gives every horse time to find its position and draw bias is generally weak. York’s straight course, similarly, is wide enough that most draws have a clean run. Lingfield’s all-weather oval shows mild bias on the straight course but minimal on the round. The pattern across UK racing’s fifty-nine licensed racecourses isn’t uniform; each course has its own character, and the punter’s job is to know which ones have biases worth caring about.
The strongest practical tool is course-specific draw statistics for the exact race conditions you’re betting on. Field size, distance, going, and time of year all interact, and a single “Chester low draw advantage” summary won’t capture the nuance. Serious punters consult draw data segmented by these variables. Casual punters who ignore the data are paying for the privilege.
How field size and pace shape the bias
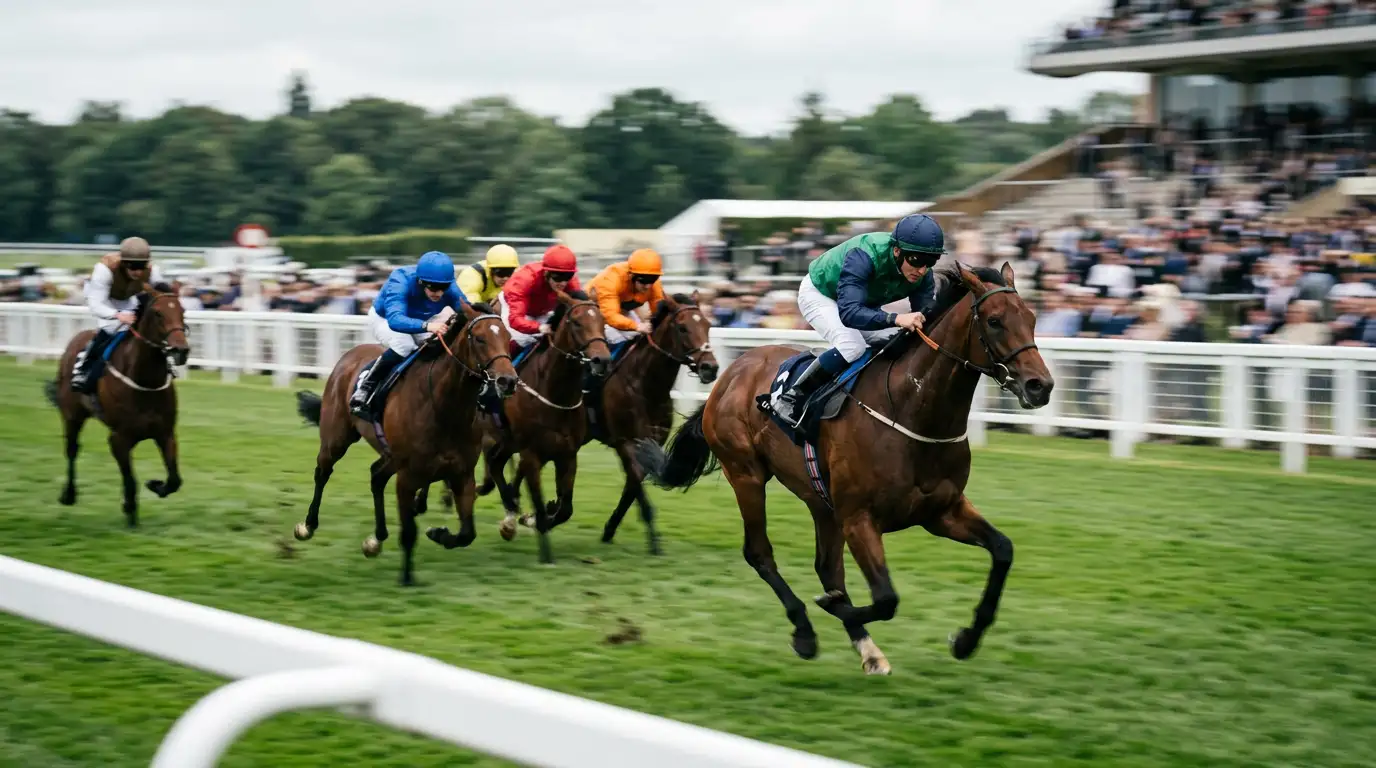
The relationship between field size and draw bias deserves its own thought. In a sixteen-runner sprint handicap, the early traffic is intense. Horses drawn in stalls one to four are racing for rail position; horses drawn fifteen and sixteen are stuck wide and have to either burn energy crossing over or accept the longer route. The bias is sharp because the field forces immediate decisions.
In a six-runner conditions race at the same course over the same distance, there’s no traffic problem. Whichever horse wants the rail can have it. The geometric disadvantage of a wide draw becomes trivial because there’s room to manoeuvre. Draw biases that look dominant in handicap data can disappear entirely in small-field races, which means using handicap-derived draw stats to bet conditions races is a category error.
Pace bias compounds this. If a race has multiple front-runners drawn together, they’ll cut each other up early, the pace will be strong, and hold-up horses with wider draws are advantaged. If a race has only one obvious front-runner drawn favourably, that horse can stroll to the front, set its own pace, and use the draw to dictate the race from start to finish. Reading the pace shape against the draw allocation tells you whether the geometric bias will dominate or whether the race will set up in a way that neutralises it.
The other interaction is with going. A course that becomes biased on soft ground might be neutral on good. A watered strip at a summer fixture might produce a bias that doesn’t exist at the same course in winter. Going-specific draw analysis is one of the more rewarding additional layers a serious punter can build — though it’s also one of the most labour-intensive, requiring tracking patterns across many races at the same course. For the underlying mechanics of how going actually shapes results, see my piece on going and ground conditions.
Using draw bias in staking decisions
The straightforward application is to downgrade horses drawn badly at courses with known biases and upgrade horses drawn well. A talented horse rated 80 in a sixteen-runner sprint at Chester drawn from stall fifteen is a different proposition from the same horse drawn from stall two. The market often prices the second case but underprices the first — particularly when the form figures look identical and the casual punter doesn’t notice the draw shift.
The more sophisticated application is to use draw bias as a filter rather than a primary selection tool. Build your usual analysis — form, ground, trainer, jockey — and then apply the draw filter at the end. Horses that pass all your other tests and have a favourable draw at a biased course are stronger bets than the same horses with neutral draws. Horses with unfavourable draws can usually be eliminated even if the form case looks good.
One trap to avoid: don’t use draw bias as a sole reason to back a horse. The bias might give a horse a structural advantage, but if the horse itself has no form claim, the advantage isn’t enough to win a competitive race. The punters who lose money on draw bias are usually the ones who back horses solely because they’re drawn well, ignoring everything else. The pattern works as a tilt to selection, not as a replacement for selection.
The other trap is overcommitting to bias on courses where the data is thin. Some courses race rarely. Some have variable conditions that shift the bias from meeting to meeting. The patterns I’d bet on confidently are the ones with hundreds of races of supporting data — Chester sprints, Beverley fives, Catterick fives, Goodwood specific trips, and a handful of others. Smaller patterns at courses with fewer fixtures should be treated as suggestive rather than decisive.
Where this fits in a real strategy
UK racing’s volume — over ten thousand races a year across three hundred and sixty-two days, on fifty-nine licensed courses — means every punter has the option to focus on courses where they understand the draw patterns intimately. The narrower the focus, the more reliable the draw filter becomes. A punter who specialises in Chester sprints will see draw bias play out hundreds of times a year and develop a feel for the specific conditions where the pattern is strongest.
The punters who try to apply draw analysis across every UK course at once usually fail. The patterns are too varied, the data too segmented, the local conditions too specific. Better to know three courses well than thirty courses badly. Pick the venues where you have a structural advantage from local knowledge, learn the draw patterns there in depth, and let the rest of the UK calendar pass without involvement.
The other dimension worth keeping in mind is that draw bias is one of the few factors in horse racing that the market can sometimes misprice consistently. Trainer form gets priced in quickly. Going changes get priced in within minutes of the official report. But draw bias requires segmented historical data and active reading of the conditions on the day, and the casual market doesn’t always do that work. The punters who do, quietly profit from those who don’t.
Which UK courses have the strongest draw bias?
Chester for almost any distance, Beverley over five furlongs in certain ground conditions, Catterick’s downhill sprint course, and Goodwood at specific trips and goings are the most consistently biased UK venues. Brighton’s tight track and parts of Carlisle and Ripon also produce notable patterns. Each course’s bias is shape-specific — a single ‘low draw good’ or ‘high draw good’ rule rarely captures the nuance, and you need data segmented by distance, going and field size.
Does draw bias disappear in small fields?
It usually does. With seven or eight runners there’s space for any horse to find any position, so the geometric advantage of a particular stall becomes noise. Bias is sharpest in big fields where the volume of traffic forces immediate decisions at the stalls and there’s no time to adjust. Using handicap-derived draw statistics to bet conditions races is a common category error — the data doesn’t transfer cleanly because the underlying dynamic changes with field size.
Can draw bias be used profitably on its own?
No — backing horses solely because they’re drawn well is a losing approach. The bias gives a structural advantage, but the horse still needs a form claim to actually win a competitive race. The reliable application is to use draw as a filter after your usual form, ground and trainer analysis: horses that pass everything else and have a favourable draw at a biased course become stronger bets, while horses with unfavourable draws can usually be eliminated even if the form looks promising.
Published by the Betting Strategy for Horse Racing team.