Trainer and Jockey Statistics: Reading the People Behind the Horses
 Available in US
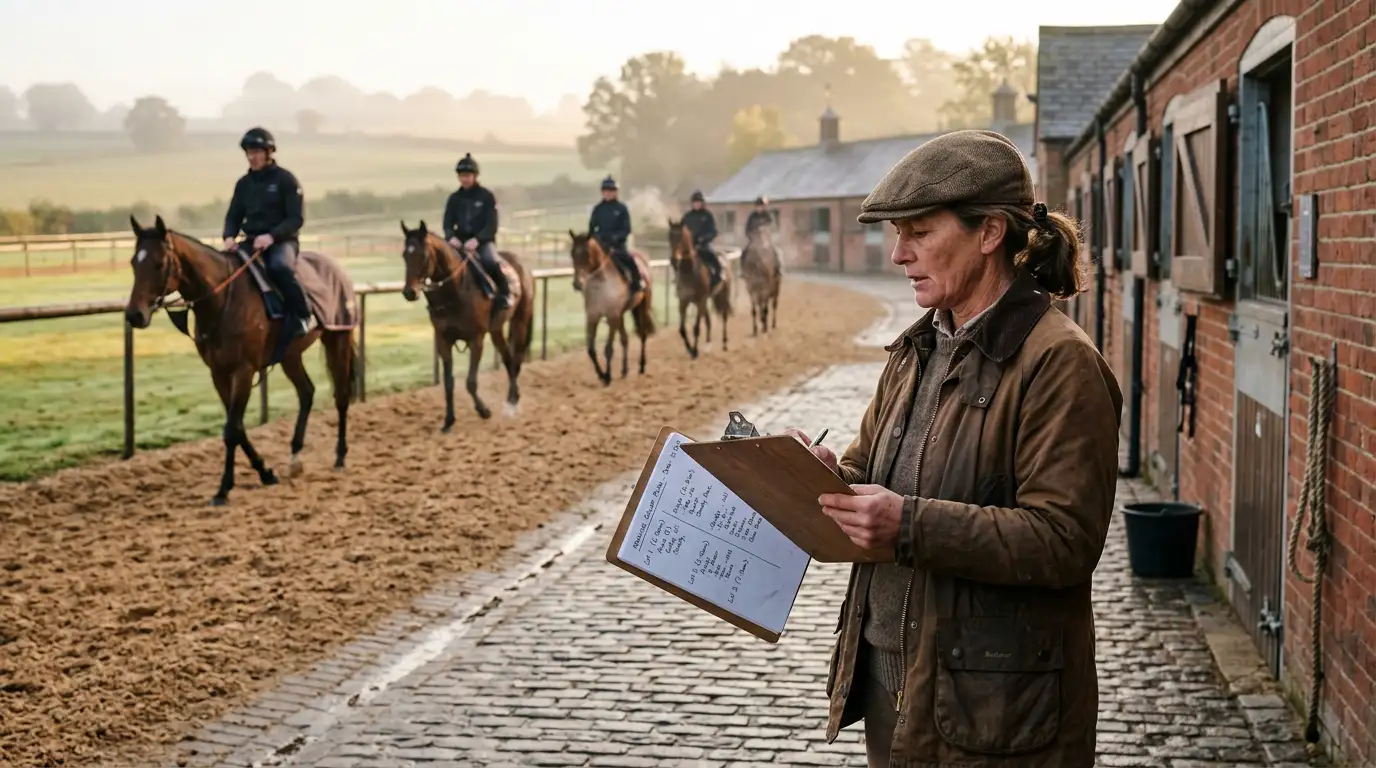
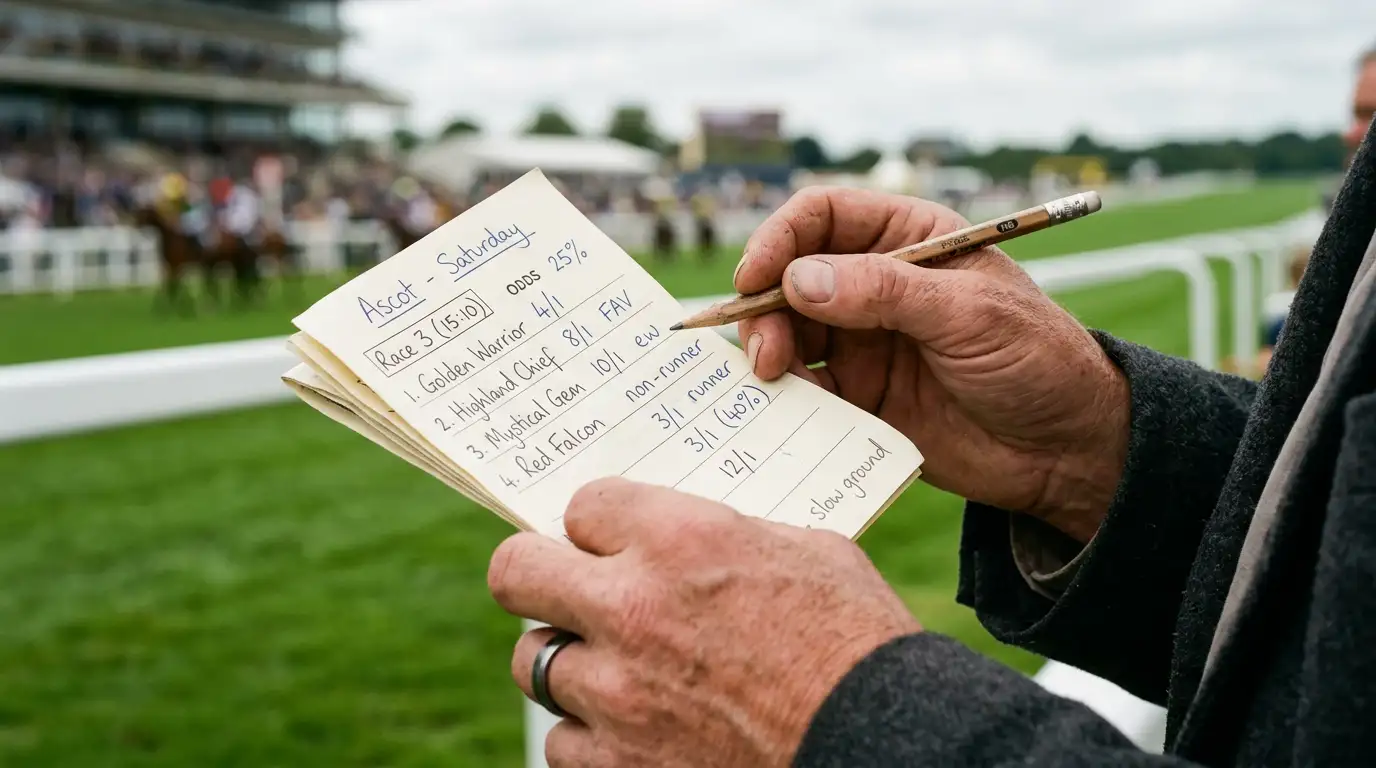
I keep a notebook of trainer patterns that goes back years. Most pages are dull — strike rates, win counts, fixtures targeted, ROI on different race types. But buried in there are observations like “Trainer X always sends one to Goodwood in late July” and “Trainer Y’s two-year-olds invariably win second time out”. Those patterns came from watching, not from any clever software. The data underneath them is freely available; the work of noticing the patterns isn’t.
Trainer and jockey statistics aren’t shortcuts to picking winners. They’re a set of measurable indicators that describe the people around each horse — how their charges have been running recently, where they specialise, which bookings signal intent — and used properly, they filter selections that would otherwise look identical on form alone. The trainer-jockey block on a racecard is part of the form, not a sidebar. Treating it as a sidebar is one of the cheapest mistakes casual punters make.
Strike rate and ROI: the two numbers that matter
Strike rate is the percentage of runners that win — straightforward, easily understood, and frequently misinterpreted. A 25% strike rate sounds impressive until you realise the same trainer’s runners typically go off at 5/4 favourite, in which case 25% is actually unprofitable. ROI (return on investment, sometimes called yield) corrects for the prices. A trainer with a 12% strike rate whose runners average 7/1 might be highly profitable; another with a 30% strike rate at average 6/4 might be a slow loser to back blindly.
The combination of the two metrics is the right way to read trainer form. Strike rate without ROI is volume; ROI without strike rate is noise from small samples. A trainer producing 50 wins from 200 runners at a positive ROI is showing genuine signal. A trainer with 3 wins from 20 runners at apparently glittering ROI might be on a hot streak that will regress to the mean by next month.
Sample size matters more than punters acknowledge. UK trainer data segmented by race type, distance, course, and going can fragment down to handfuls of runs. A strike rate calculated on 12 runs at a particular course is essentially random. Real signal usually requires 50+ runs at minimum, and even then I treat the numbers as suggestive rather than definitive. The trainers I’d back confidently on strike-rate data alone are the ones whose pattern holds across hundreds of runs across multiple seasons.
UK racing’s headline figure of 34.4% favourites winning over the last five years — across the entire UK turf, jumps, and all-weather programme — gives a useful baseline for context. A trainer whose runners are winning at a 34% rate isn’t doing anything special; they’re matching the general favourite hit rate. A trainer whose runners are winning at 45% across a meaningful sample is producing genuinely above-market signal. The benchmark matters.
The 14-day form window
The most common ready-made trainer statistic is the 14-day strike rate — the percentage of a yard’s runners that have won in the previous two weeks. The figure is published on most racecards and form services. Trainers running hot on this metric attract attention; trainers cold on it get downgraded by the market.
The metric has real predictive value but only in a limited sense. A yard winning regularly in the recent fortnight is probably in form — fit horses, well-targeted entries, things going right. A yard with zero recent wins from 12 runners is probably out of form, possibly with a virus or some other issue affecting horse condition. Both signals are usable.
The limitation is that 14 days isn’t long enough to be statistically robust. Twelve runners with two winners is a 17% rate; the same yard could easily have produced zero or four winners from the same horses with slightly different luck. The metric works best at extremes — yards with sustained cold streaks or genuinely hot weeks — and is unreliable in the middle ranges where most yards spend most of the time.
I use the 14-day figure as a filter rather than as a selection tool. Trainers running clearly above their long-term average are worth taking seriously even on horses with modest individual form; trainers running clearly below are worth fading even on horses with good individual form. Trainers running in their normal range get no adjustment — the 14-day figure tells me nothing useful in that case.
For the longer-term context of this metric, my work on record keeping covers the question of how many bets a punter needs before drawing conclusions about their own performance — and the same principles apply to evaluating trainer data. Small samples mislead, structured logs reveal patterns, and the discipline of waiting for adequate sample sizes is what separates analysis from guessing.
Course specialists and why they exist
Some trainers have remarkably strong records at specific courses. The pattern isn’t accidental. A yard that has been sending horses to a particular course for decades develops an understanding of what works there — which distances, what going, what kind of horse handles the local geometry. The local knowledge compounds across many runners and shows up in the data as a meaningfully elevated strike rate.
The trainers worth flagging as course specialists are the ones whose strike rate at a single course substantially exceeds their overall strike rate, across a sample large enough to be meaningful. A yard producing 30% winners at Goodwood while running at 18% nationally is signalling something real about that combination. The same yard producing 18% across most courses but 22% at one specific track might just be hitting a streak; the difference needs to be substantial and sustained to count.
Geography drives much of this. Trainers based near a particular course often have an embedded local advantage: regular schooling on the gallops at the course, transport efficiency that lets them send horses fresh rather than tired, and accumulated insight from running there week after week. The Yorkshire trainers at York, the Newmarket yards at Newmarket, the Lambourn operations at Lambourn-affiliated meetings — these patterns repeat for good reasons.
The corresponding pattern is yards with conspicuously poor records at particular courses. Sometimes these are trainers who simply don’t like the layout and rarely target runners there; sometimes it’s a structural issue with the kind of horses the yard produces. Either way, a trainer with a clearly poor course-specific record sending a horse to that course is sending a slightly suspect runner, and the market often doesn’t price the negative pattern as clearly as the positive ones.
Trainer-jockey combinations as intent signals
The bookings on a racecard contain information that doesn’t appear in the form figures. A trainer who normally uses a stable jockey but books a top freelance for a particular horse is signalling something about that horse. A trainer who pairs a specific jockey with a specific horse for the third consecutive run is signalling continuity and confidence. A trainer who switches jockeys after a horse has run well is signalling a change of plan.
The combinations that matter most are the ones where a yard pays for outside expertise rather than using their in-house rider. Booking a champion jockey for a specific runner — particularly when the trainer doesn’t normally use that jockey — is one of the strongest signals available. The trainer is telling you, in the most public way possible, that they think this horse has a winning chance worth paying premium for. Owners frequently insist on these bookings for serious targets, and the willingness to incur the cost is information.
The opposite signal is also useful. A horse appearing with the stable’s apprentice or a low-profile booking, especially in a race where the trainer would normally book stronger, often signals that the horse isn’t fully fancied. Sometimes this reflects an entry that the trainer is using for fitness or experience rather than as a real attempt to win. Reading those bookings against the rest of the race tells you which runners the connections themselves rate highest.
The BHA’s Director of Racing Richard Wayman has commented publicly that the sport faces significant headwinds — the comment that the industry is “all very conscious” of these pressures has been a recurring theme in his statements over the past two years. Some of that pressure flows through to trainer behaviour: yards under economic stress sometimes change their patterns, target races differently, or place horses with different jockey strategies than they once would have. The horse population in training has been declining at roughly 1.5% annually since 2022, and the resulting smaller strings at individual yards have shifted some of the long-established trainer-targeting patterns that experienced punters relied on. For punters who track trainer behaviour, those shifts can be early signals of broader changes in how a yard is operating.
What the casual market still gets wrong
The market handles trainer strike rates reasonably well on the headline yards. Aidan O’Brien, John Gosden, Willie Mullins, Nicky Henderson — the prices on their runners reflect the trainer’s stature accurately. The mispricings live further down the table, where smaller yards with genuinely strong patterns get less media coverage and the market doesn’t fully integrate their form.
The other common mispricing is on yards whose 14-day form is cold despite a strong long-term record. A top yard going through a quiet patch often gets quietly downgraded in the market for individual runners, even when there’s no real reason to think the yard’s horses are unfit. The 14-day signal is being treated as more informative than it actually is, and the prices on runners from temporarily quiet but structurally strong yards can offer value.
The casual market also tends to over-react to a single big-priced winner. A yard producing a 50/1 winner on Tuesday gets attention on Wednesday’s runners, and the next horse from the yard often goes off shorter than it should. The 50/1 result was almost certainly an outlier rather than a signal of yard form, and the market’s enthusiasm for following hot yards into the next race is one of the more reliable patterns to bet against.
How I use trainer and jockey data day-to-day
For each race I’m seriously considering, I check the trainer’s 14-day form, the trainer’s record at the course over the last two seasons, the trainer’s strike rate by race type for similar conditions, and the jockey booking. None of these factors override the form analysis on the horse itself — they’re supplementary filters. But they consistently help me distinguish between horses with similar form figures where one is from a yard in form and the other isn’t.
The combination I’d back most readily is a horse with solid recent form, from a yard with a strong 14-day strike rate, at a course where the yard has a meaningful long-term record, with a jockey booking that signals serious intent. That combination doesn’t appear often. When it does, the price is sometimes still attractive — particularly outside the headline meetings where the market hasn’t done the work to spot the pattern.
The opposite combination — a horse from a yard out of form, at a course they don’t normally target, with a low-profile booking — is the kind of selection casual punters back because the individual horse’s form looks reasonable. The contextual signals are pointing in the wrong direction, and ignoring them is how the market keeps pricing those horses in a way that bleeds money over time.
What strike rate makes a trainer worth backing?
Strike rate alone isn’t enough — you need ROI alongside it. A 30% strike rate trainer whose runners average 6/4 may be a slow loser to back blindly, while a 12% strike rate trainer whose runners average 7/1 may be highly profitable. The combination matters. For context, UK racing’s general favourite win rate over the last five years sits at 34.4%, so any trainer running below that on favourites isn’t actually outperforming the baseline.
How predictive is 14-day trainer form?
It’s useful at extremes — yards clearly above or below their long-term average — and unreliable in the middle ranges where most trainers spend most of the time. The fundamental issue is sample size: twelve runners with two winners is a 17% rate, but the same horses could easily have produced zero or four winners with slightly different luck. Use it as a filter on horses you’d already consider, not as a primary selection tool.
Do trainer-jockey booking patterns reveal intent?
Yes — particularly when a yard breaks its normal booking pattern for a specific horse. A trainer who normally uses a stable jockey booking a top freelance is signalling that the runner is fancied seriously. A horse appearing with an apprentice or low-profile rider, in a race where the trainer would normally book stronger, often signals reduced fancy. The bookings on a racecard carry information that doesn’t show up in the form figures.
Written by the editors at Betting Strategy for Horse Racing.